
Orgel Diagrams
- Page ID
- 11252

Orgel diagrams are useful for showing the energy levels of both high spin octahedral and tetrahedral transition metal ions. They ONLY show the spin-allowed transitions. For complexes with D ground terms only one electronic transition is expected and the transition energy corresponds directly to D. Hence, the following high spin configurations are dealt with: d1, d4, d6 and d9.
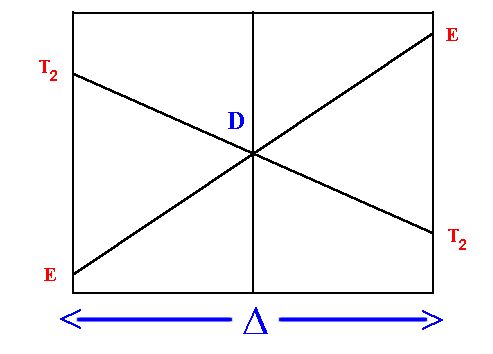
On the left hand side d1, d6 tetrahedral and d4, d9 octahedral complexes are covered and on the right hand side d4, d9 tetrahedral and d1, d6 octahedral. For simplicity, the g subscripts required for the octahedral complexes are not shown.
For complexes with F ground terms, three electronic transitions are expected and D may not correspond directly to a transition energy. The following configurations are dealt with: d2, d3, high spin d7 and d8.
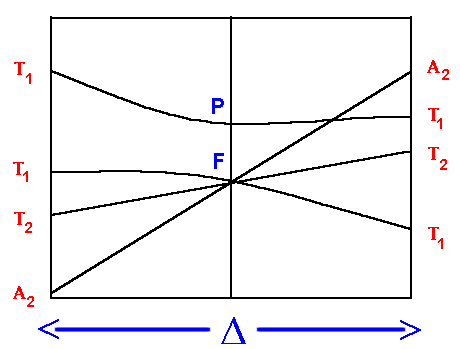
On the left hand side, d2, d7 tetrahedral and d3, d8 octahedral complexes are covered and on the right hand side d3, d8 tetrahedral and d2 and high spin d7 octahedral. Again for simplicity, the g subscripts required for the octahedral complexes are not shown.
On the left hand side, the first transition corresponds to D, the equation to calculate the second contains expressions with both D and C.I. (the configuration interaction from repulsion of like terms) and the third has expressions which contain D, C.I. and the Racah parameter B.
- 4T2g <--- 4A2g transition energy = D
- 4T1g(F) <--- 4A2g transition energy = 9/5 *D - C.I.
- 4T1g(P) <--- 4A2g transition energy = 6/5 *D + 15B' + C.I.
On the right hand side, the first transition can be unambiguously assigned as:
3T2g <--- 3T1g transition energy = 4/5 *D + C.I.
But, depending on the size of the ligand field (D) the second transition may be due to:
3A2g <--- 3T1g transition energy = 9/5 *D + C.I.
for a weak field or
3T1g(P) <--- 3T1g transition energy = 3/5 *D + 15B' + 2 * C.I.
for a strong field.
Tanabe-Sugano Diagrams
An alternative method is to use Tanabe Sugano diagrams, which are able to predict the transition energies for both spin-allowed and spin-forbidden transitions, as well as for both strong field (low spin), and weak field (high spin) complexes. In this method the energy of the electronic states are given on the vertical axis and the ligand field strength increases on the horizontal axis from left to right. Linear lines are found when there are no other terms of the same type and curved lines are found when 2 or more terms are repeated. This is as a result of the "non-crossing rule". The baseline in the Tanabe-Sugano diagram represents the lowest energy or ground term state.
The electronic spectrum of the V3+ ion, where V(III) is doped into alumina (Al2O3), shows three major peaks with frequencies of: \(\nu_1\)=17400 cm-1, \(\nu_2\)=25400 cm-1 and \(\nu_3\)=34500 cm-1.
These have been assigned to the following spin-allowed transitions.
- 3T2g<---3T1g
- 3T1g(P)<---3T1g
- 3A2g<---3T1g
The ratio between the first two transitions is calculated as \(\frac{\nu_1}{\nu_2}\) which is equal to 25400 / 17400 = 1.448.
To calculate the Racah parameter, B, the position on the horizontal axis where the ratio between the lines representing \(\nu_2\) and \(\nu_1\) is equal to 1.448, has to be determined. On the diagram below, this occurs at D/B=30.9. Having found this value, a vertical line is drawn at this position.
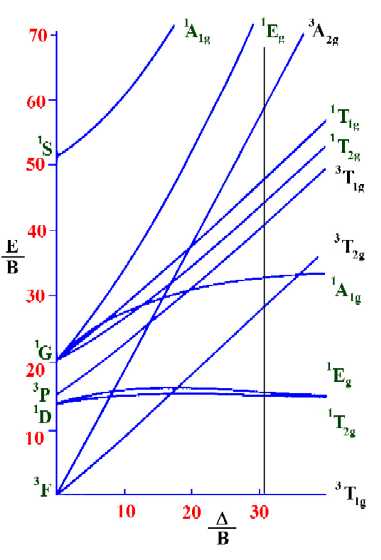
On moving up the line from the ground term to where lines from the other terms cross it, we are able to identify both the spin-forbidden and spin-allowed transition and hence the total number of transitions that are possible in the electronic spectrum.
Next, find the values on the vertical axis that correspond to the spin-allowed transitions so as to determine the values of n1/B, n2/B and n3/B. From the diagram above these are 28.78, 41.67 and 59.68 respectively.
Knowing the values of n1, n2 and n3, we can now calculate the value of B. Since n1/B=28.78 and n1 is equal to 17,400 cm-1, then
\[B=\dfrac{n_1}{28.78} = \dfrac{17400}{28.78} \nonumber \]
or
\[B=604.5\;cm^{-1} \nonumber \]
Then it is possible to calculate the value of D. Since D/B=30.9, then: D=B*30.9 and hence: D = 604.5 * 30.9 = 18680 cm-1
Calculate the value of B and D for the Cr3+ ion in [Cr(H2O)6)]3+ if n1=17000 cm-1, n2=24000 cm-1 and n3=37000 cm-1.
Solution
These values have been assigned to the following spin-allowed transitions.
\[^4T_{2g} \leftarrow ^ 4A_{2g} \nonumber \]
\[^4T_{1g} \leftarrow ^ 4A_{2g} \nonumber \]
\[^4T_{1g}(P) \leftarrow ^4A_{2g} \nonumber \]
From the information given, the ratio \(n_2 / n_1 = 24000 / 17000 = 1.412\). Using a Tanabe-Sugano diagram for a d3 system this ratio is found at D/B=24.00
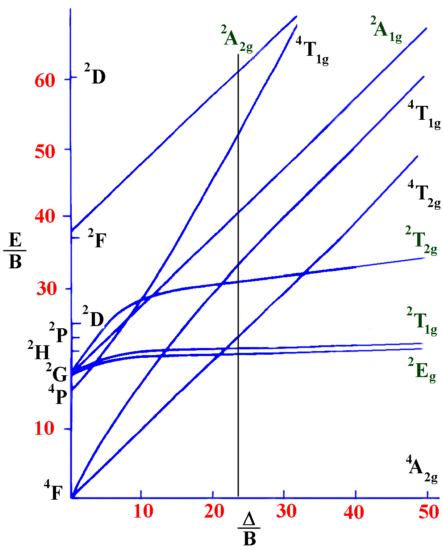
Interpolation of the graph to find the Y-axis values for the spin-allowed transitions gives:
- \(\dfrac{n_1}{B}=24.00\)
- \(\dfrac{n_2}{B}=33.90\)
- \(\dfrac{n_3}{B}=53.11\)
Recall that \(n_1=17000 \,cm^{-1}\). Therefore for the first spin-allowed transition,
17000 /B =24.00 from which B can be obtained, B=17000 / 24.00 or B=708.3 cm-1.
This information is then used to calculate D.
Since D / B=24.00 then D = B*24.00 = 708.3 * 24.00 = 17000 cm-1.
It is observed that the value of Racah parameter \(B\) in the complex is 708.3 cm-1, while the value of B in the free Cr3+ ion is 1030 cm-1. This shows a 31% reduction in the Racah parameter indicating a strong Nephelauxetic effect.
The Nephelauxetic Series is as follows:
F->H2O>urea>NH3 >en~C2O42- >NCS- >Cl-~CN->Br- >S2- ~I-.
Ionic ligands such as F-give small reduction in B, while covalently bonded ligands such as I- give a large reduction in B.
The original paper by Tanabe and Sugano[10] had the d5 and d6 diagrams each missing a T term from excited I states. These diagrams were reproduced in the often quoted text by Figgis[12(a)] and so the errors have been perpetuated. An exception is the text by Purcell and Kotz[15] where the missing T terms have been included, however in their case they have ignored lower lying terms from excited D, F, G and H states which for d5 are the main transitions seen in the spin forbidden spectra of Mn(II) complexes.
A set of qualitative diagrams have been drawn for each configuration (which include the missing T terms) and along with the newest release of "Ligand Field Theory and its applications" by Figgis and Hitchman [12(b)] represent the only examples of Tanabe-Sugano diagrams that provide a comprehensive set of terms for spectral interpretation
References
- Basic Inorganic Chemistry, F.A.Cotton, G.Wilkinson and P.L.Gaus, 3rd edition, John Wiley and Sons, Inc. New York, 1995.
- Physical Inorganic Chemistry, S.F.A.Kettle, Oxford University Press, New York, 1998.
- Complexes and First-Row Transition Elements, D.Nicholls, Macmillan Press Ltd, London 1971.
- The Chemistry of the Elements, N.N.Greenwood and A.Earnshaw, Pergamon Press, Oxford, 1984.
- Concepts and Models of Inorganic Chemistry, B.E.Douglas, D.H.McDaniel and J.J.Alexander 2nd edition, John Wiley & Sons, New York, 1983.
- Inorganic Chemistry, J.A.Huheey, 3rd edition, Harper & Row, New York, 1983.
- Inorganic Chemistry, G.L.Meissler and D.A.Tarr, 2nd edition, Prentice Hall, New Jersey, 1998.
- Inorganic Chemistry, D.F.Shriver and P.W.Atkins, 3rd edition, W.H.Freeman, New York, 1999.
- Basic Principles of Ligand Field Theory, H.L.Schlafer and G.Gliemann, Wiley-Interscience, New York, 1969.
- Y.Tanabe and S.Sugano, J. Phys. Soc. Japan, 9, 1954, 753 and 766.
- a). Inorganic Electronic Spectroscopy, A.B.P.Lever, 2nd Edition, Elsevier Publishing Co., Amsterdam, 1984.
- (b). A.B.P.Lever in Werner Centennial, Adv. in Chem Series, 62, 1967, Chapter 29, 430.
- (a). Introduction to Ligand Fields, B.N.Figgis, Wiley, New York, 1966.
- (b). Ligand Field Theory and its applications, B.N. Figgis and M.A. Hitchman, Wiley-VCH, New York, 2000.
- E.Konig, Structure and Bonding, 9, 1971, 175.
- Y. Dou, J. Chem. Educ, 67, 1990, 134.
- Inorganic Chemistry, K.F. Purcell and J.C. Kotz, W.B. Saunders Company, Philadelphia, USA, 1977.
Contributors and Attributions
Prof. Robert J. Lancashire (The Department of Chemistry, University of the West Indies)