
5.5: Spin-spin coupling
- Page ID
- 1060

5.5A: The source of spin-spin coupling
The 1H-NMR spectra that we have seen so far (of methyl acetate and para-xylene) are somewhat unusual in the sense that in both of these molecules, each set of protons generates a single NMR signal. In fact, the 1H-NMR spectra of most organic molecules contain proton signals that are 'split' into two or more sub-peaks. Rather than being a complication, however, this splitting behavior actually provides us with more information about our sample molecule.
Consider the spectrum for 1,1,2-trichloroethane. In this and in many spectra to follow, we show enlargements of individual signals so that the signal splitting patterns are recognizable.
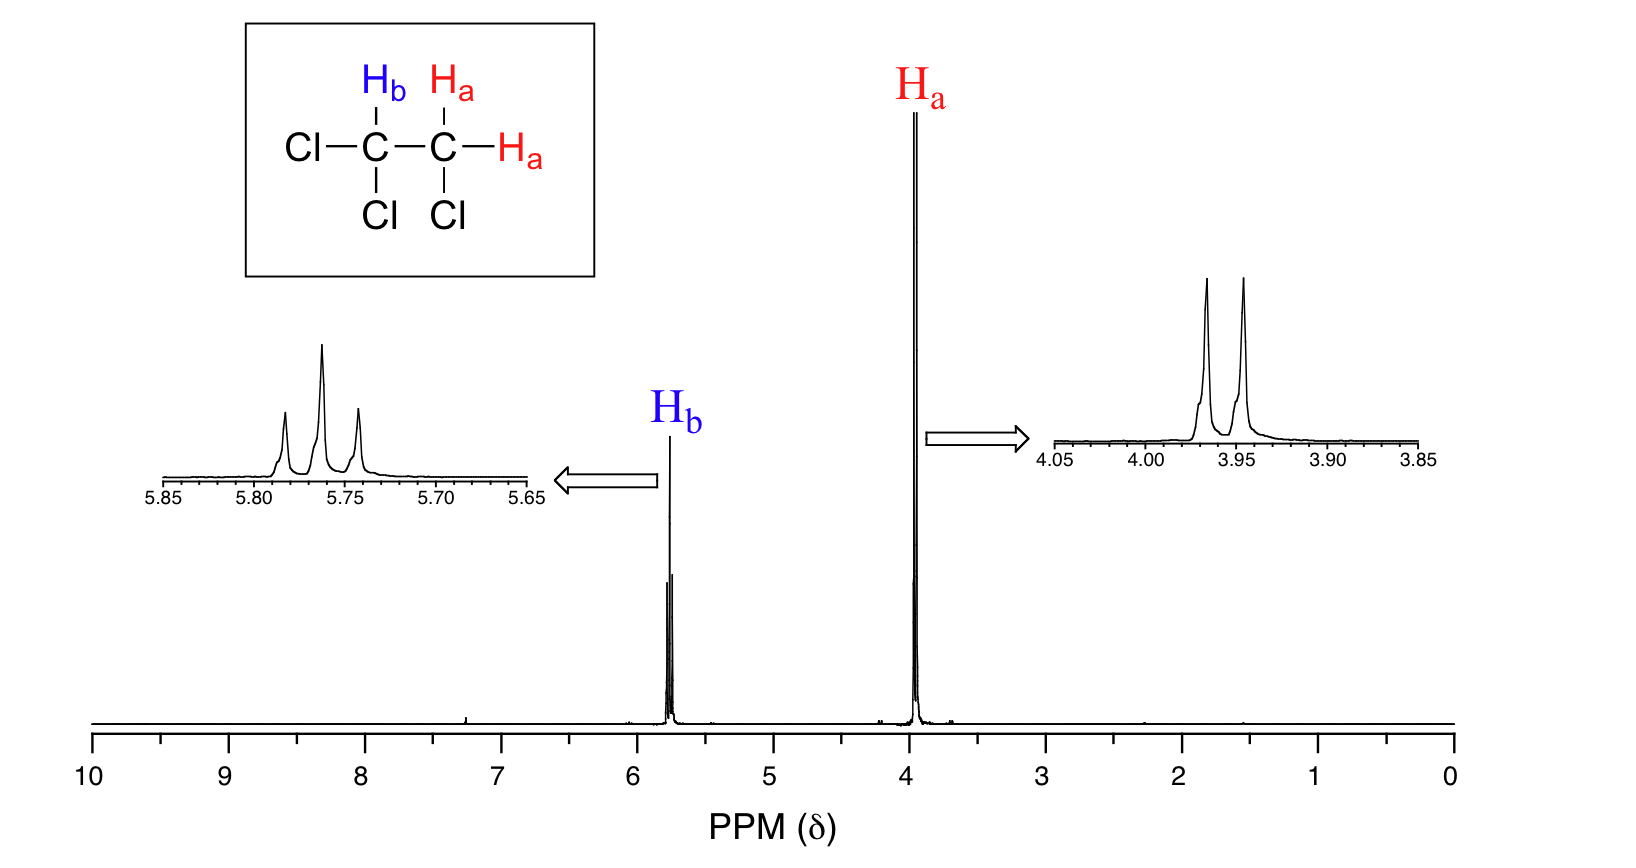
The signal at 3.96 ppm, corresponding to the two Ha protons, is split into two subpeaks of equal height (and area) – this is referred to as a doublet. The Hb signal at 5.76 ppm, on the other hand, is split into three sub-peaks, with the middle peak higher than the two outside peaks - if we were to integrate each subpeak, we would see that the area under the middle peak is twice that of each of the outside peaks. This is called a triplet.
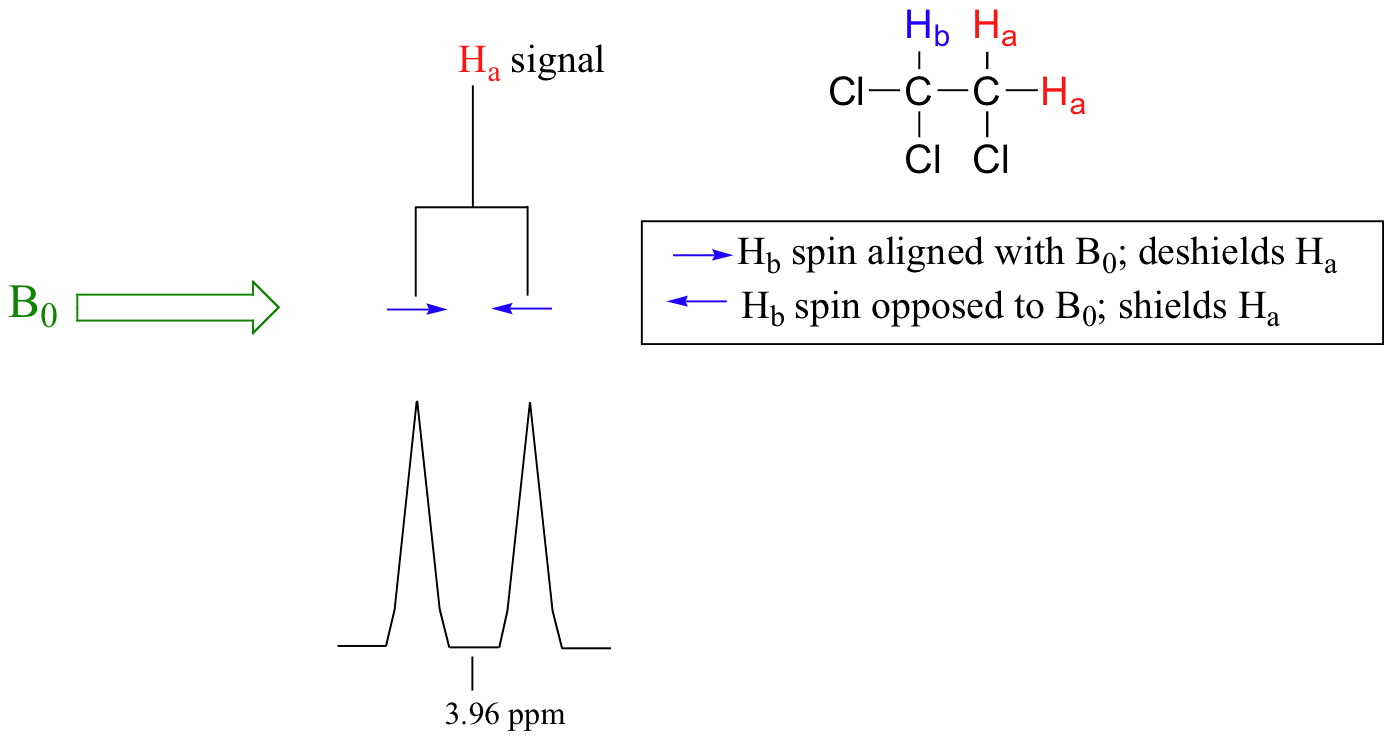
The source of signal splitting is a phenomenon called spin-spin coupling, a term that describes the magnetic interactions between neighboring, non-equivalent NMR-active nuclei. In our 1,1,2 trichloromethane example, the Ha and Hb protons are spin-coupled to each other. Here's how it works, looking first at the Ha signal: in addition to being shielded by nearby valence electrons, each of the Ha protons is also influenced by the small magnetic field generated by Hb next door (remember, each spinning proton is like a tiny magnet). The magnetic moment of Hb will be aligned with B0 in (slightly more than) half of the molecules in the sample, while in the remaining half of the molecules it will be opposed to B0. The Beff ‘felt’ by Ha is a slightly weaker if Hb is aligned against B0, or slightly stronger if Hb is aligned with B0. In other words, in half of the molecules Ha is shielded by Hb (thus the NMR signal is shifted slightly upfield) and in the other half Ha is deshielded by Hb(and the NMR signal shifted slightly downfield). What would otherwise be a single Ha peak has been split into two sub-peaks (a doublet), one upfield and one downfield of the original signal. These ideas an be illustrated by a splitting diagram, as shown below.
Now, let's think about the Hbsignal. The magnetic environment experienced by Hb is influenced by the fields of both neighboring Ha protons, which we will call Ha1 and Ha2. There are four possibilities here, each of which is equally probable. First, the magnetic fields of both Ha1 and Ha2 could be aligned with B0, which would deshield Hb, shifting its NMR signal slightly downfield. Second, both the Ha1 and Ha2 magnetic fields could be aligned opposed to B0, which would shield Hb, shifting its resonance signal slightly upfield. Third and fourth, Ha1 could be with B0 and Ha2 opposed, or Ha1opposed to B0 and Ha2 with B0. In each of the last two cases, the shielding effect of one Ha proton would cancel the deshielding effect of the other, and the chemical shift of Hb would be unchanged.
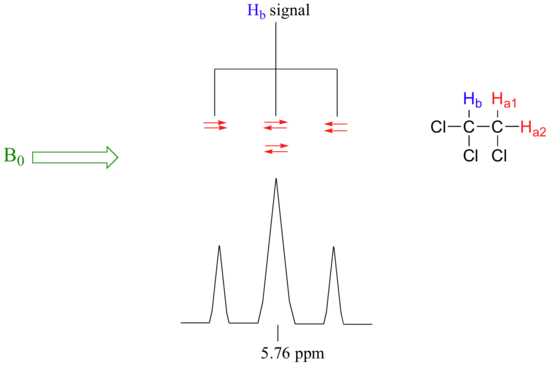
So in the end, the signal for Hb is a triplet, with the middle peak twice as large as the two outer peaks because there are two ways that Ha1 and Ha2 can cancel each other out.
Now, consider the spectrum for ethyl acetate:
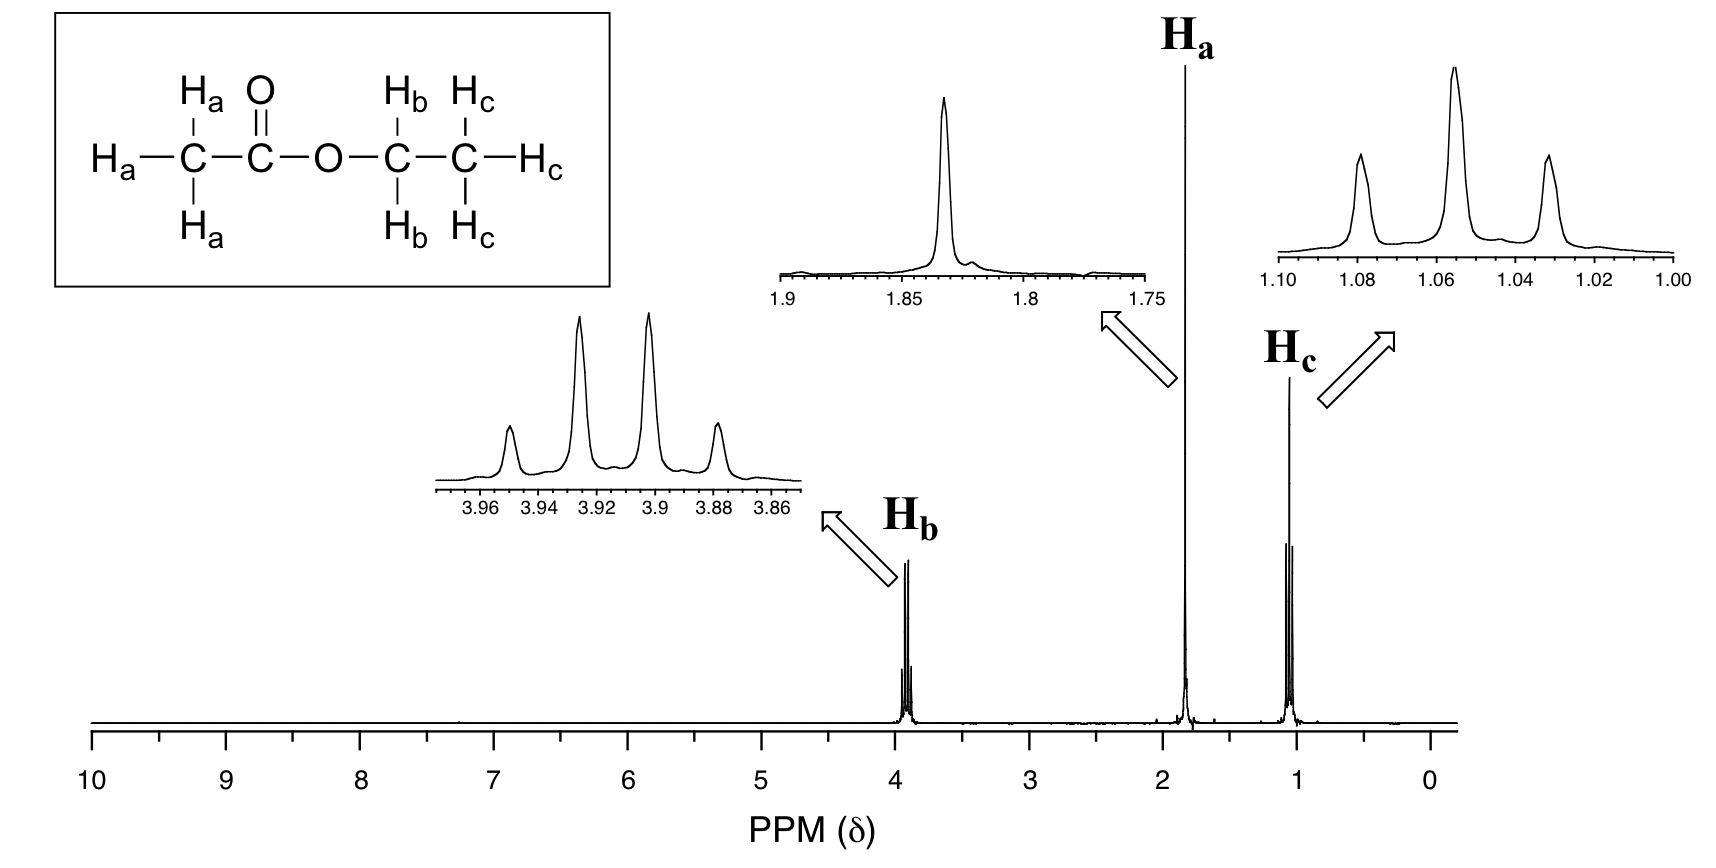
We see an unsplit 'singlet' peak at 1.833 ppm that corresponds to the acetyl (Ha) hydrogens – this is similar to the signal for the acetate hydrogens in methyl acetate that we considered earlier. This signal is unsplit because there are no adjacent hydrogens on the molecule. The signal at 1.055 ppm for the Hc hydrogens is split into a triplet by the two Hb hydrogens next door. The explanation here is the same as the explanation for the triplet peak we saw previously for 1,1,2-trichloroethane.
The Hbhydrogens give rise to a quartet signal at 3.915 ppm – notice that the two middle peaks are taller then the two outside peaks. This splitting pattern results from the spin-coupling effect of the three Hc hydrogens next door, and can be explained by an analysis similar to that which we used to explain the doublet and triplet patterns.
Example 5.6
- Explain, using left and right arrows to illustrate the possible combinations of nuclear spin states for the Hc hydrogens, why the Hb signal in ethyl acetate is split into a quartet.
- The integration ratio of doublets is 1:1, and of triplets is 1:2:1. What is the integration ratio of the Hb quartet in ethyl acetate? (Hint – use the illustration that you drew in part a to answer this question.)
By now, you probably have recognized the pattern which is usually referred to as the n + 1 rule: if a set of hydrogens has n neighboring, non-equivalent hydrogens, it will be split into n + 1 subpeaks. Thus the two Hb hydrogens in ethyl acetate split the Hc signal into a triplet, and the three Hc hydrogens split the Hb signal into a quartet. This is very useful information if we are trying to determine the structure of an unknown molecule: if we see a triplet signal, we know that the corresponding hydrogen or set of hydrogens has two `neighbors`. When we begin to determine structures of unknown compounds using 1H-NMR spectral data, it will become more apparent how this kind of information can be used.
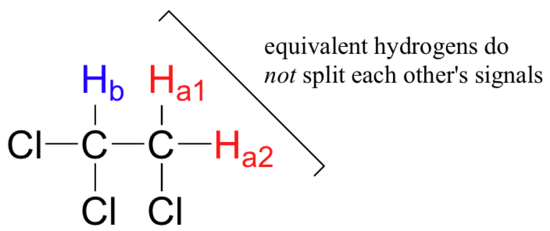
Three important points need to be emphasized here. First, signal splitting only occurs between non-equivalent hydrogens – in other words, Ha1 in 1,1,2-trichloroethane is not split by Ha2, and vice-versa.
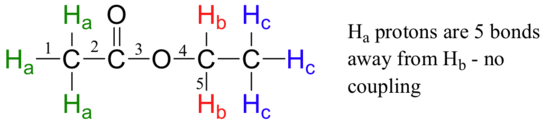
Second, splitting occurs primarily between hydrogens that are separated by three bonds. This is why the Ha hydrogens in ethyl acetate form a singlet– the nearest hydrogen neighbors are five bonds away, too far for coupling to occur.
Occasionally we will see four-bond and even 5-bond splitting, but in these cases the magnetic influence of one set of hydrogens on the other set is much more subtle than what we typically see in three-bond splitting (more details about how we quantify coupling interactions is provided in section 5.5B). Finally, splitting is most noticeable with hydrogens bonded to carbon. Hydrogens that are bonded to heteroatoms (alcohol or amino hydrogens, for example) are coupled weakly - or not at all - to their neighbors. This has to do with the fact that these protons exchange rapidly with solvent or other sample molecules.
Below are a few more examples of chemical shift and splitting pattern information for some relatively simple organic molecules.


Example 5.7
- How many proton signals would you expect to see in the 1H-NMR spectrum of triclosan (a common antimicrobial agent found in detergents)? For each of the proton signals, predict the splitting pattern. Assume that you see only 3-bond coupling.
Example 5.8
Predict the splitting pattern for the 1H-NMR signals corresponding to the protons at the locations indicated by arrows (the structure is that of the neurotransmitter serotonin).
5.5B: Coupling constants
Chemists quantify the spin-spin coupling effect using something called the coupling constant, which is abbreviated with the capital letter J. The coupling constant is simply the difference, expressed in Hz, between two adjacent sub-peaks in a split signal. For our doublet in the 1,1,2-trichloroethane spectrum, for example, the two subpeaks are separated by 6.1 Hz, and thus we write 3Ja-b = 6.1 Hz.
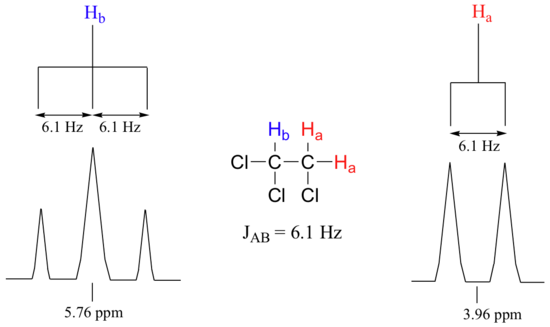
The superscript 3 tells us that this is a three-bond coupling interaction, and the a-b subscript tells us that we are talking about coupling between Ha and Hb. Unlike the chemical shift value, the coupling constant, expressed in Hz, is the same regardless of the applied field strength of the NMR magnet. This is because the strength of the magnetic moment of a neighboring proton, which is the source of the spin-spin coupling phenomenon, does not depend on the applied field strength.
When we look closely at the triplet signal in 1,1,2-trichloroethane, we see that the coupling constant - the `gap` between subpeaks - is 6.1 Hz, the same as for the doublet. This is an important concept! The coupling constant 3Ja-b quantifies the magnetic interaction between the Ha and Hb hydrogen sets, and this interaction is of the same magnitude in either direction. In other words, Ha influences Hb to the same extent that Hb influences Ha. When looking at more complex NMR spectra, this idea of reciprocal coupling constants can be very helpful in identifying the coupling relationships between proton sets.
Coupling constants between proton sets on neighboring sp3-hybridized carbons is typically in the region of 6-8 Hz. With protons bound to sp2-hybridized carbons, coupling constants can range from 0 Hz (no coupling at all) to 18 Hz, depending on the bonding arrangement.

For vinylic hydrogens in a trans configuration, we see coupling constants in the range of 3J = 11-18 Hz, while cis hydrogens couple in the 3J = 6-15 Hz range. The 2-bond coupling between hydrogens bound to the same alkene carbon (referred to as geminal hydrogens) is very fine, generally 5 Hz or lower. Ortho hydrogens on a benzene ring couple at 6-10 Hz, while 4-bond coupling of up to 4 Hz is sometimes seen between meta hydrogens.
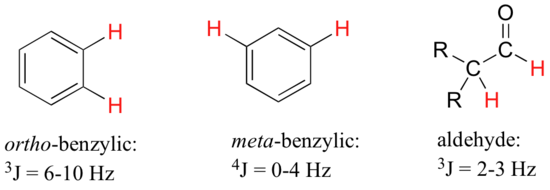
Fine (2-3 Hz) coupling is often seen between an aldehyde proton and a three-bond neighbor. Table 4 lists typical constant values.
5.5C: Complex coupling
In all of the examples of spin-spin coupling that we have seen so far, the observed splitting has resulted from the coupling of one set of hydrogens to just one neighboring set of hydrogens. When a set of hydrogens is coupled to two or more sets of nonequivalent neighbors, the result is a phenomenon called complex coupling. A good illustration is provided by the 1H-NMR spectrum of methyl acrylate:

First, let's first consider the Hc signal, which is centered at 6.21 ppm. Here is a closer look:

With this enlargement, it becomes evident that the Hc signal is actually composed of four sub-peaks. Why is this? Hc is coupled to both Ha and Hb , but with two different coupling constants. Once again, a splitting diagram can help us to understand what we are seeing. Ha is trans to Hc across the double bond, and splits the Hc signal into a doublet with a coupling constant of 3Jac = 17.4 Hz. In addition, each of these Hc doublet sub-peaks is split again by Hb (geminal coupling) into two more doublets, each with a much smaller coupling constant of 2Jbc = 1.5 Hz.
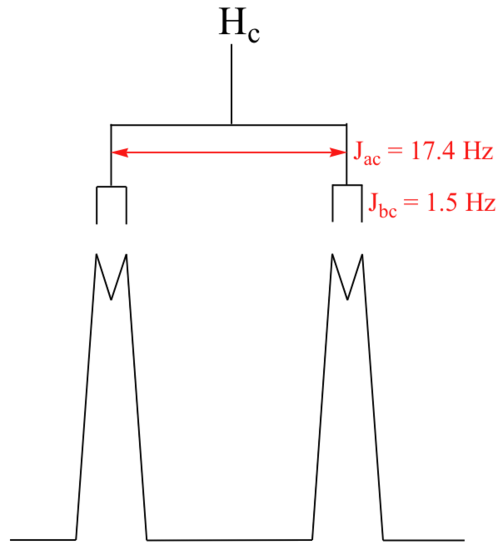
The result of this `double splitting` is a pattern referred to as a doublet of doublets, abbreviated `dd`.
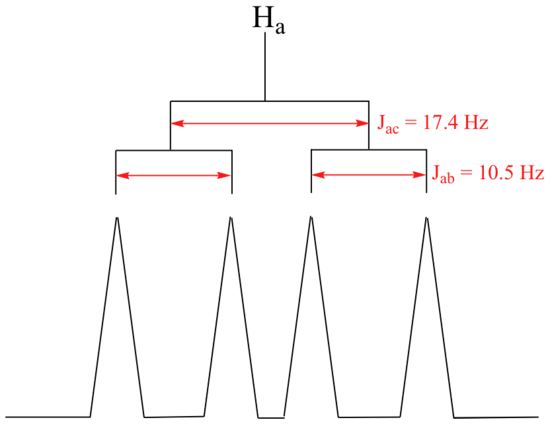
The signal for Ha at 5.95 ppm is also a doublet of doublets, with coupling constants 3Jac= 17.4 Hz and 3Jab = 10.5 Hz.
The signal for Hb at 5.64 ppm is split into a doublet by Ha, a cis coupling with 3Jab = 10.4 Hz. Each of the resulting sub-peaks is split again by Hc, with the same geminal coupling constant 2Jbc = 1.5 Hz that we saw previously when we looked at the Hc signal. The overall result is again a doublet of doublets, this time with the two `sub-doublets` spaced slightly closer due to the smaller coupling constant for the cis interaction. Here is a blow-up of the actual Hbsignal:

Example 5.9
Construct a splitting diagram for the Hb signal in the 1H-NMR spectrum of methyl acrylate. Show the chemical shift value for each sub-peak, expressed in Hz (assume that the resonance frequency of TMS is exactly 300 MHz).
When constructing a splitting diagram to analyze complex coupling patterns, it is usually easier to show the larger splitting first, followed by the finer splitting (although the reverse would give the same end result).
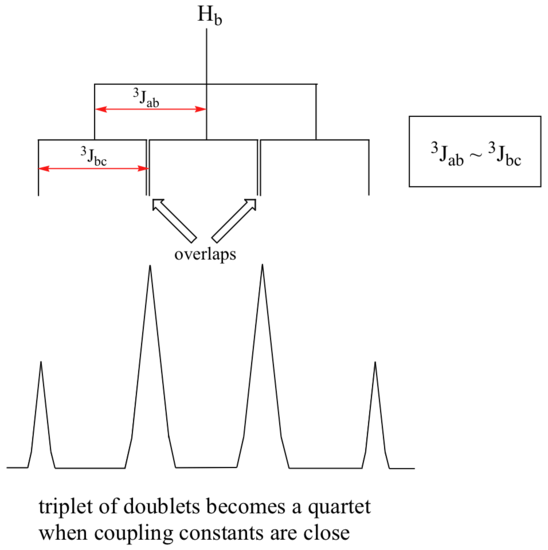
When a proton is coupled to two different neighboring proton sets with identical or very close coupling constants, the splitting pattern that emerges often appears to follow the simple `n + 1 rule` of non-complex splitting. In the spectrum of 1,1,3-trichloropropane, for example, we would expect the signal for Hb to be split into a triplet by Ha, and again into doublets by Hc, resulting in a 'triplet of doublets'.
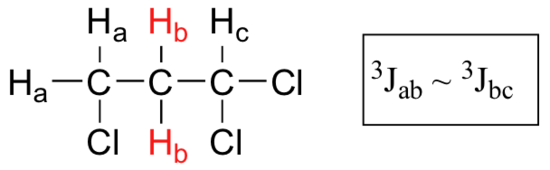
Ha and Hc are not equivalent (their chemical shifts are different), but it turns out that 3Jab is very close to 3Jbc. If we perform a splitting diagram analysis for Hb, we see that, due to the overlap of sub-peaks, the signal appears to be a quartet, and for all intents and purposes follows the n + 1 rule.
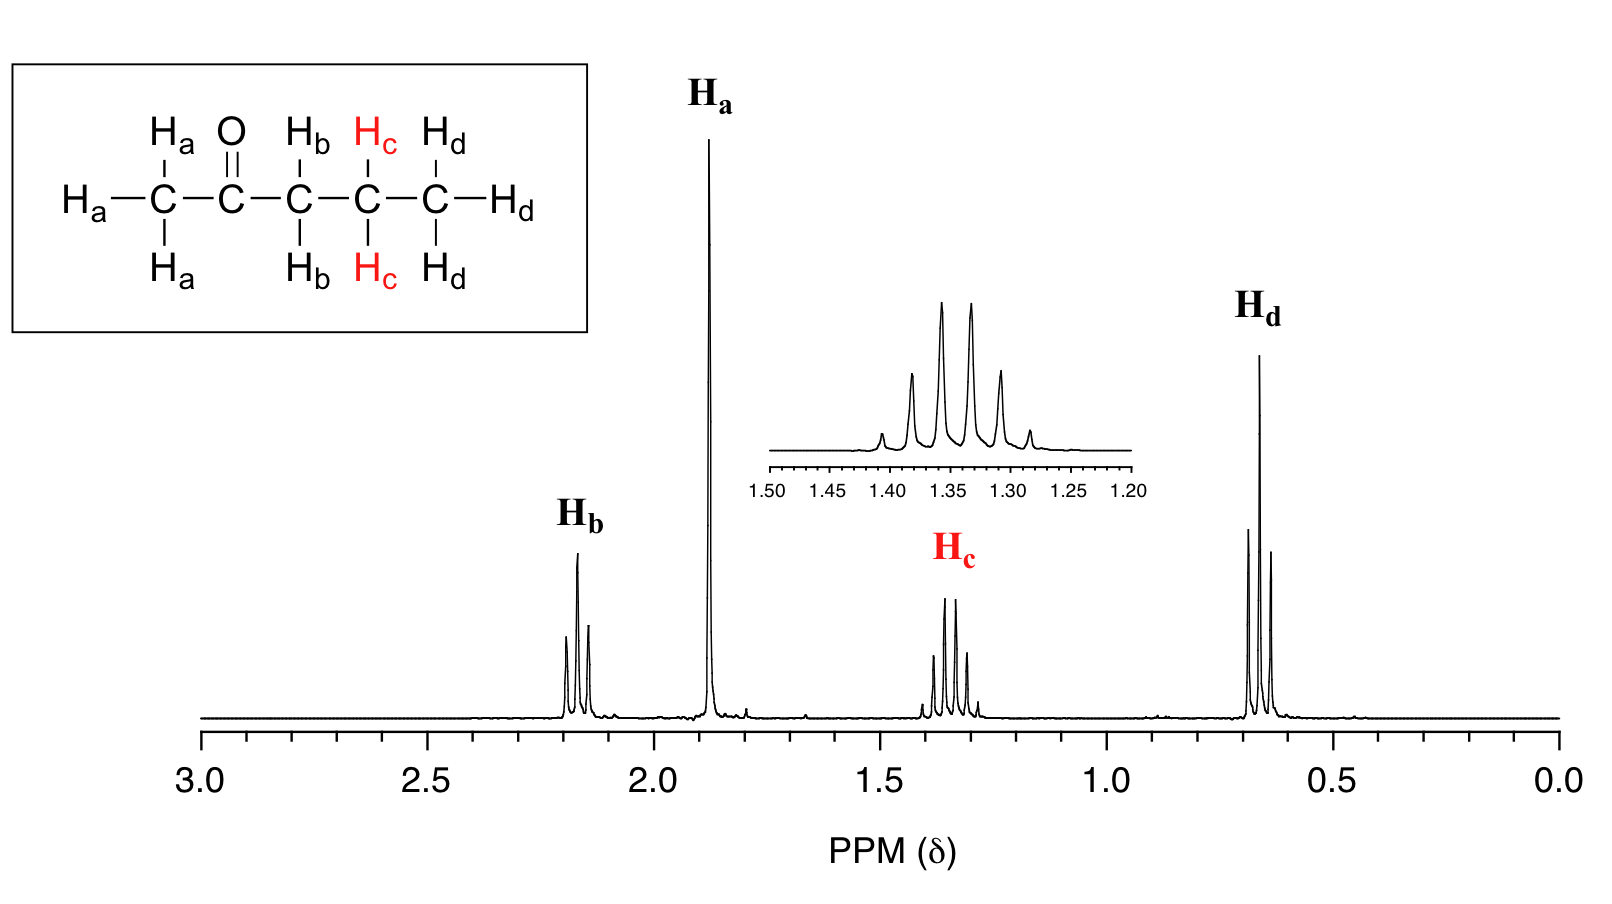
For similar reasons, the Hc peak in the spectrum of 2-pentanone appears as a sextet, split by the five combined Hb and Hd protons. Technically, this 'sextet' could be considered to be a 'triplet of quartets' with overlapping sub-peaks.
Example 5.10
What splitting pattern would you expect for the signal coresponding to Hb in the molecule below? Assume that Jab ~ Jbc. Draw a splitting diagram for this signal, and determine the relative integration values of each subpeak.

In many cases, it is difficult to fully analyze a complex splitting pattern. In the spectrum of toluene, for example, if we consider only 3-bond coupling we would expect the signal for Hb to be a doublet, Hd a triplet, and Hc a triplet.

In practice, however, all three aromatic proton groups have very similar chemical shifts and their signals overlap substantially, making such detailed analysis difficult. In this case, we would refer to the aromatic part of the spectrum as a multiplet.
When we start trying to analyze complex splitting patterns in larger molecules, we gain an appreciation for why scientists are willing to pay large sums of money (hundreds of thousands of dollars) for higher-field NMR instruments. Quite simply, the stronger our magnet is, the more resolution we get in our spectrum. In a 100 MHz instrument (with a magnet of approximately 2.4 Tesla field strength), the 12 ppm frequency 'window' in which we can observe proton signals is 1200 Hz wide. In a 500 MHz (~12 Tesla) instrument, however, the window is 6000 Hz - five times wider. In this sense, NMR instruments are like digital cameras and HDTVs: better resolution means more information and clearer pictures (and higher price tags!)