
2.10: Zero-Order Reactions
- Page ID
- 1451
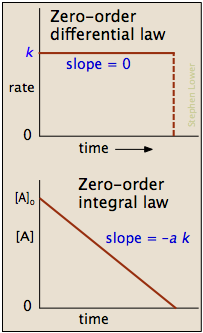
In some reactions, the rate is apparently independent of the reactant concentration. The rates of these zero-order reactions do not vary with increasing nor decreasing reactants concentrations. This means that the rate of the reaction is equal to the rate constant, \(k\), of that reaction. This property differs from both first-order reactions and second-order reactions.
Origin of Zero Order Kinetics
Zero-order kinetics is always an artifact of the conditions under which the reaction is carried out. For this reason, reactions that follow zero-order kinetics are often referred to as pseudo-zero-order reactions. Clearly, a zero-order process cannot continue after a reactant has been exhausted. Just before this point is reached, the reaction will revert to another rate law instead of falling directly to zero as depicted at the upper left.
There are two general conditions that can give rise to zero-order rates:
- Only a small fraction of the reactant molecules are in a location or state in which they are able to react, and this fraction is continually replenished from the larger pool.
- When two or more reactants are involved, the concentrations of some are much greater than those of others
This situation commonly occurs when a reaction is catalyzed by attachment to a solid surface (heterogeneous catalysis) or to an enzyme.
Nitrous oxide will decompose exothermically into nitrogen and oxygen, at a temperature of approximately 575 °C
\[\ce{2N_2O ->[\Delta, \,Ni] 2N_2(g) + O_2(g)} \nonumber \]
This reaction in the presence of a hot platinum wire (which acts as a catalyst) is zero-order, but it follows more conventional second order kinetics when carried out entirely in the gas phase.
\[\ce{2N_2O -> 2N_2(g) + O_2(g)} \nonumber \]
In this case, the \(N_2O\) molecules that react are limited to those that have attached themselves to the surface of the solid catalyst. Once all of the sites on the limited surface of the catalyst have been occupied, additional gas-phase molecules must wait until the decomposition of one of the adsorbed molecules frees up a surface site.
Enzyme-catalyzed reactions in organisms begin with the attachment of the substrate to the active site on the enzyme, leading to the formation of an enzyme-substrate complex. If the number of enzyme molecules is limited in relation to substrate molecules, then the reaction may appear to be zero-order.
This is most often seen when two or more reactants are involved. Thus if the reaction
\[ A + B \rightarrow \text{products} \tag{1} \]
is first-order in both reactants so that
\[\text{rate} = k [A][B] \tag{2} \]
If \(B\) is present in great excess, then the reaction will appear to be zero order in \(B\) (and first order overall). This commonly happens when \(B\) is also the solvent that the reaction occurs in.
Differential Form of the Zeroth Order Rate Law
\[Rate = - \dfrac{d[A]}{dt} = k[A]^0 = k = constant \tag{3} \]
where \(Rate\) is the reaction rate and \(k\) is the reaction rate coefficient. In this example, the units of \(k\) are M/s. The units can vary with other types of reactions. For zero-order reactions, the units of the rate constants are always M/s. In higher order reactions, \(k\) will have different units.
Integrated Form of the Zeroth Order Rate Law
Integration of the differential rate law yields the concentration as a function of time. Start with the general rate law equations
\[Rate = k[A]^n \tag{4} \]
First, write the differential form of the rate law with \(n=0\)
\[Rate = - \dfrac{d[A]^0}{dt} = k \tag{5} \]
then rearrange
\[{d}[A] = -kdt \tag{6} \]
Second, integrate both sides of the equation.
\[\int_{[A]_{0}}^{[A]} d[A] = - \int_{0}^{t} kdt \tag{7} \]
Third, solve for \([A]\). This provides the integrated form of the rate law.
\[[A] = [A]_0 -kt \tag{8} \]
The integrated form of the rate law allows us to find the population of reactant at any time after the start of the reaction.
Graphing Zero-order Reactions
\[[A] = -kt + [A]_0 \tag{9} \]
is in the form y = mx+b where slope = m = -k and the y- intercept = b = \([A]_0\)
Zero-order reactions are only applicable for a very narrow region of time. Therefore, the linear graph shown below (Figure 2) is only realistic over a limited time range. If we were to extrapolate the line of this graph downward to represent all values of time for a given reaction, it would tell us that as time progresses, the concentration of our reactant becomes negative. We know that concentrations can never be negative, which is why zero-order reaction kinetics is applicable for describing a reaction for only brief window and must eventually transition into kinetics of a different order.
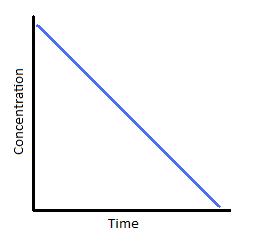
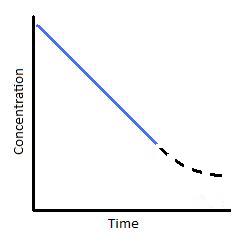
Figure 2: (left) Concentration vs. time of a zero-order reaction. (Right) Concentration vs. time of a zero-order catalyzed reaction.
To understand where the above graph comes from, let us consider a catalyzed reaction. At the beginning of the reaction, and for small values of time, the rate of the reaction is constant; this is indicated by the blue line in Figures 2; right. This situation typically happens when a catalyst is saturated with reactants. With respect to Michaelis-Menton kinetics, this point of catalyst saturation is related to the \(V_{max}\). As a reaction progresses through time, however, it is possible that less and less substrate will bind to the catalyst. As this occurs, the reaction slows and we see a tailing off of the graph (Figure 2; right). This portion of the reaction is represented by the dashed black line. In looking at this particular reaction, we can see that reactions are not zero-order under all conditions. They are only zero-order for a limited amount of time.
If we plot rate as a function of time, we obtain the graph below (Figure 3). Again, this only describes a narrow region of time. The slope of the graph is equal to k, the rate constant. Therefore, k is constant with time. In addition, we can see that the reaction rate is completely independent of how much reactant you put in.
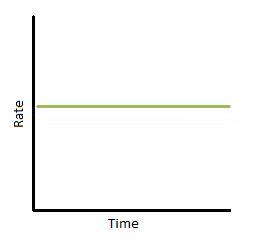
Figure 3: Rate vs. time of a zero-order reaction.
Relationship Between Half-life and Zero-order Reactions
The half-life. \(t_{1/2}\), is a timescale in which each half-life represents the reduction of the initial population to 50% of its original state. We can represent the relationship by the following equation.
\[[A] = \dfrac{1}{2} [A]_o \tag{10} \]
Using the integrated form of the rate law, we can develop a relationship between zero-order reactions and the half-life.
\[[A] = [A]_o - kt \tag{11} \]
Substitute
\[\dfrac{1}{2}[A]_o = [A]_o - kt_{\dfrac{1}{2}} \tag{12} \]
Solve for \(t_{1/2}\)
\[t_{1/2} = \dfrac{[A]_o}{2k} \tag{13} \]
Notice that, for zero-order reactions, the half-life depends on the initial concentration of reactant and the rate constant.
Questions
- Using the integrated form of the rate law, determine the rate constant k of a zero-order reaction if the initial concentration of substance A is 1.5 M and after 120 seconds the concentration of substance A is 0.75 M.
- Using the substance from the previous problem, what is the half-life of substance A if its original concentration is 1.2 M?
- If the original concentration is reduced to 1.0 M in the previous problem, does the half-life decrease, increase, or stay the same? If the half-life changes what is the new half-life?
- Given are the rate constants k of three different reactions:
- Reaction A: k = 2.3 M-1s-1
- Reaction B: k = 1.8 Ms-1
- Reaction C: k = 0.75 s-1
Which reaction represents a zero-order reaction?
- True/False: If the rate of a zero-order reaction is plotted as a function of time, the graph is a strait line where \( rate = k\ ).
Answers
- The rate constant k is 0.00624 M/s
- The half-life is 96 seconds.
- Since this is a zero-order reaction, the half-life is dependent on the concentration. In this instance, the half-life is decreased when the original concentration is reduced to 1.0 M. The new half-life is 80 seconds.
- Reaction B represents a zero-order reaction because the units are in M/s. Zero-order reactions always have rate constants that are represented by molars per unit of time. Higher order reactions, however, require the rate constant to be represented in different units.
- True. When using the rate function \( rate = k[A]^n \) with n equal to zero in zero-order reactions. Therefore, rate is equal to the rate constant k.
Summary
The kinetics of any reaction depend on the reaction mechanism, or rate law, and the initial conditions. If we assume for the reaction A -> Products that there is an initial concentration of reactant of [A]0 at time t=0, and the rate law is an integral order in A, then we can summarize the kinetics of the zero-order reaction as follows:
Related Topics
- Rate laws and rate constants
- The determination of the rate law
- Reaction Order
- First-order reactions
- Half-lives and Pharmacokinetics
- Second-order reactions
References
- Petrucci, Ralph H., William S. Harwood, Geoffrey Herring, and Jeffry D. Madura. General Chemistry: Principles & Modern Applications. Ninth ed. Upper Saddle River, N.J.: Pearson Education, 2007. Print.
Contributors and Attributions
- Rachael Curtis, Jessica Martin, David Cao